
চিত্ৰ:Energy change inventory, 1971-2010.svg

মূল ফাইল (SVG ফাইল, সাধাৰণতঃ 525 × 365 পিক্সেল, ফাইল মাত্ৰা: 2 KB)
| এই ফাইলটো ৱিকিমিডিয়া কমন্সৰ পৰা আমদানি কৰা হৈছে। ফাইল বিৱৰণ পৃষ্ঠাৰ সবিশেষ তথ্য তলত উল্লেখ কৰা হ’ল ।
|
সাৰাংশ
| বিৱৰণ |
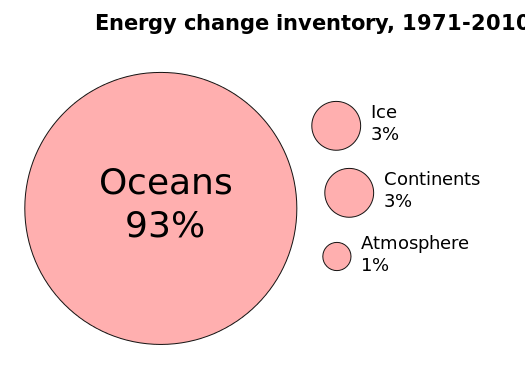
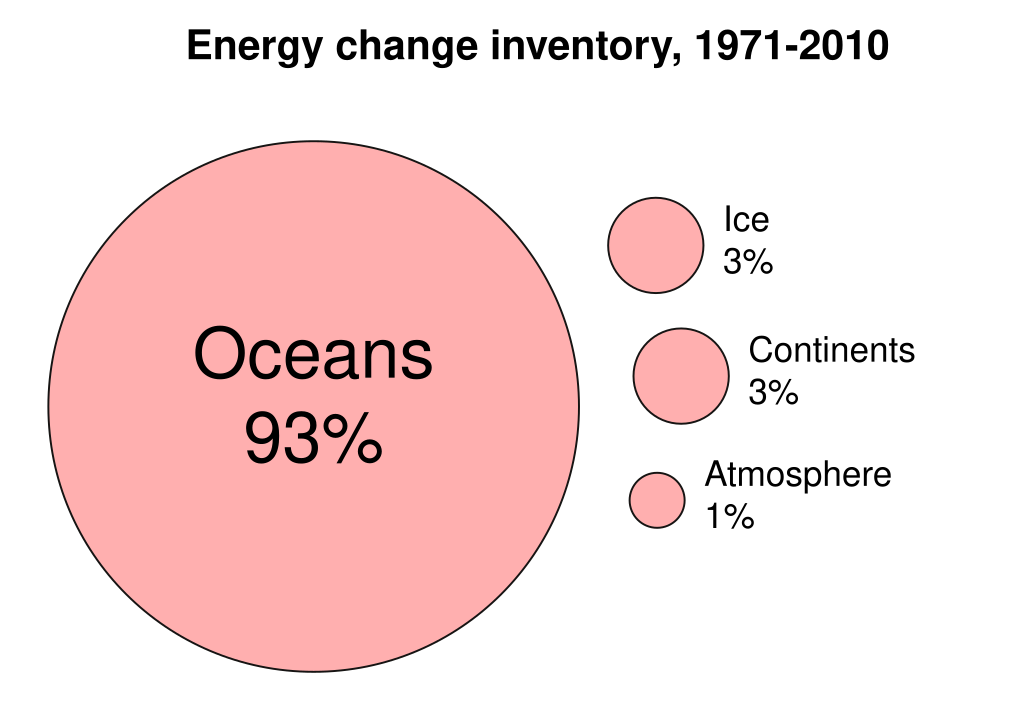
English: This bubble graph shows how the extra energy trapped by anthropogenic (i.e., human) greenhouse gases has been distributed on the Earth. This is referred to as "radiative imbalance", where less energy leaves Earth's atmosphere than enters it. Earth has been in radiative imbalance since at least the 1970s. Most of this extra energy has been absorbed by the oceans.
Data The following data shows how the extra energy trapped mainly by anthropogenic greenhouse gases has been distributed on the Earth between 1971 and 2010:
The biggest uncertainty is found in the energy invertory of the deep ocean (more than 700 m) due to a scarcity of data points. The deep ocean accounts for 29% procent of the total extra energy trapped. Further information can be found in the source listed in the references section. References
|
| তাৰিখ | |
| উৎস | নিজা কাৰ্য |
| লেখক | Enescot |
| অন্যান্য সংস্কৰণ |
 |
Comma-separated values
In this graph, the area of the circles is proportional to the sink's absorption of energy. The radius of the circles equals the square root of (area / π).
Data were exported from OpenOffice.org 4.0.0 Calc as comma separated values (csv). The following options were used:
- Character set: Western Europe 1252
- Field delimiter: ,
- Text delimiter: "
- Quote all text cells: no
- Save cell content as shown: yes
- Fixed column width: no
Sink,a=area,r=radius,d=diameter
Oceans,93,5.4408473067,10.8816946134
Ice,3,0.9772050238,1.9544100476
Continents,3,0.9772050238,1.9544100476
Atmosphere,1,0.5641895835,1.1283791671
অনুজ্ঞাপত্ৰ
| This file is made available under the Creative Commons CC0 1.0 Universal Public Domain Dedication. | |
| The person who associated a work with this deed has dedicated the work to the public domain by waiving all of their rights to the work worldwide under copyright law, including all related and neighboring rights, to the extent allowed by law. You can copy, modify, distribute and perform the work, even for commercial purposes, all without asking permission.
|
ফাইলৰ ইতিবৃত্ত
ফাইলৰ আগৰ অৱস্থা চাবলৈ সেই তাৰিখ/সময়ত ক্লিক কৰক।
| তাৰিখ/সময় | ক্ষুদ্ৰ প্ৰতিকৃতি | আকাৰ | সদস্য | মন্তব্য | |
|---|---|---|---|---|---|
| বৰ্তমান | 07:55, 15 April 2015 | | 525 × 365 (2 KB) | Mikima | fixed font rendering |
| 07:04, 7 November 2013 |  | 656 × 456 (31 KB) | Enescot | User created page with UploadWizard |
ফাইল ব্যৱহাৰ
এই ফাইলটো কোনো পৃষ্ঠাই ব্যৱহাৰ কৰা নাই
ফাইলৰ গোলকীয় ব্যৱহাৰ
তলত দিয়া আন ৱিকিসমূহে এই ফাইলটো ব্যৱহাৰ কৰে:
- es.wikipedia.org-ৰ ব্যৱহাৰ
- nl.wikipedia.org-ৰ ব্যৱহাৰ